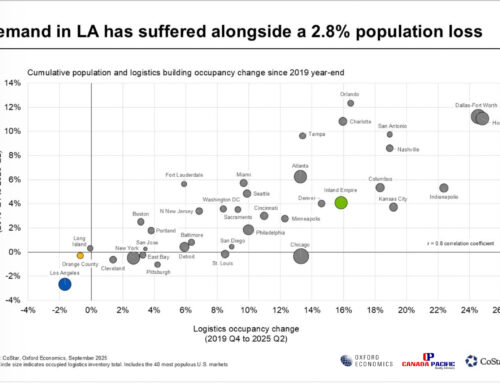
Baselines are everything when calculating values over time. That includes property prices and where they’re heading.
Trepp did a recent analytic update of its Trepp Property Price Index (TPPI), which measures CRE price movements over time. “It is constructed based on proprietary CRE transaction data from Trepp and its partners using a repeat sales methodology,” they wrote. “In total, we calculated 569,900 repeat sales since 2000 and have added 9,192 new sale pairs in 2024 Q1. The index is equally weighted, ensuring a balanced representation of various property types and price tiers across the CRE market.”
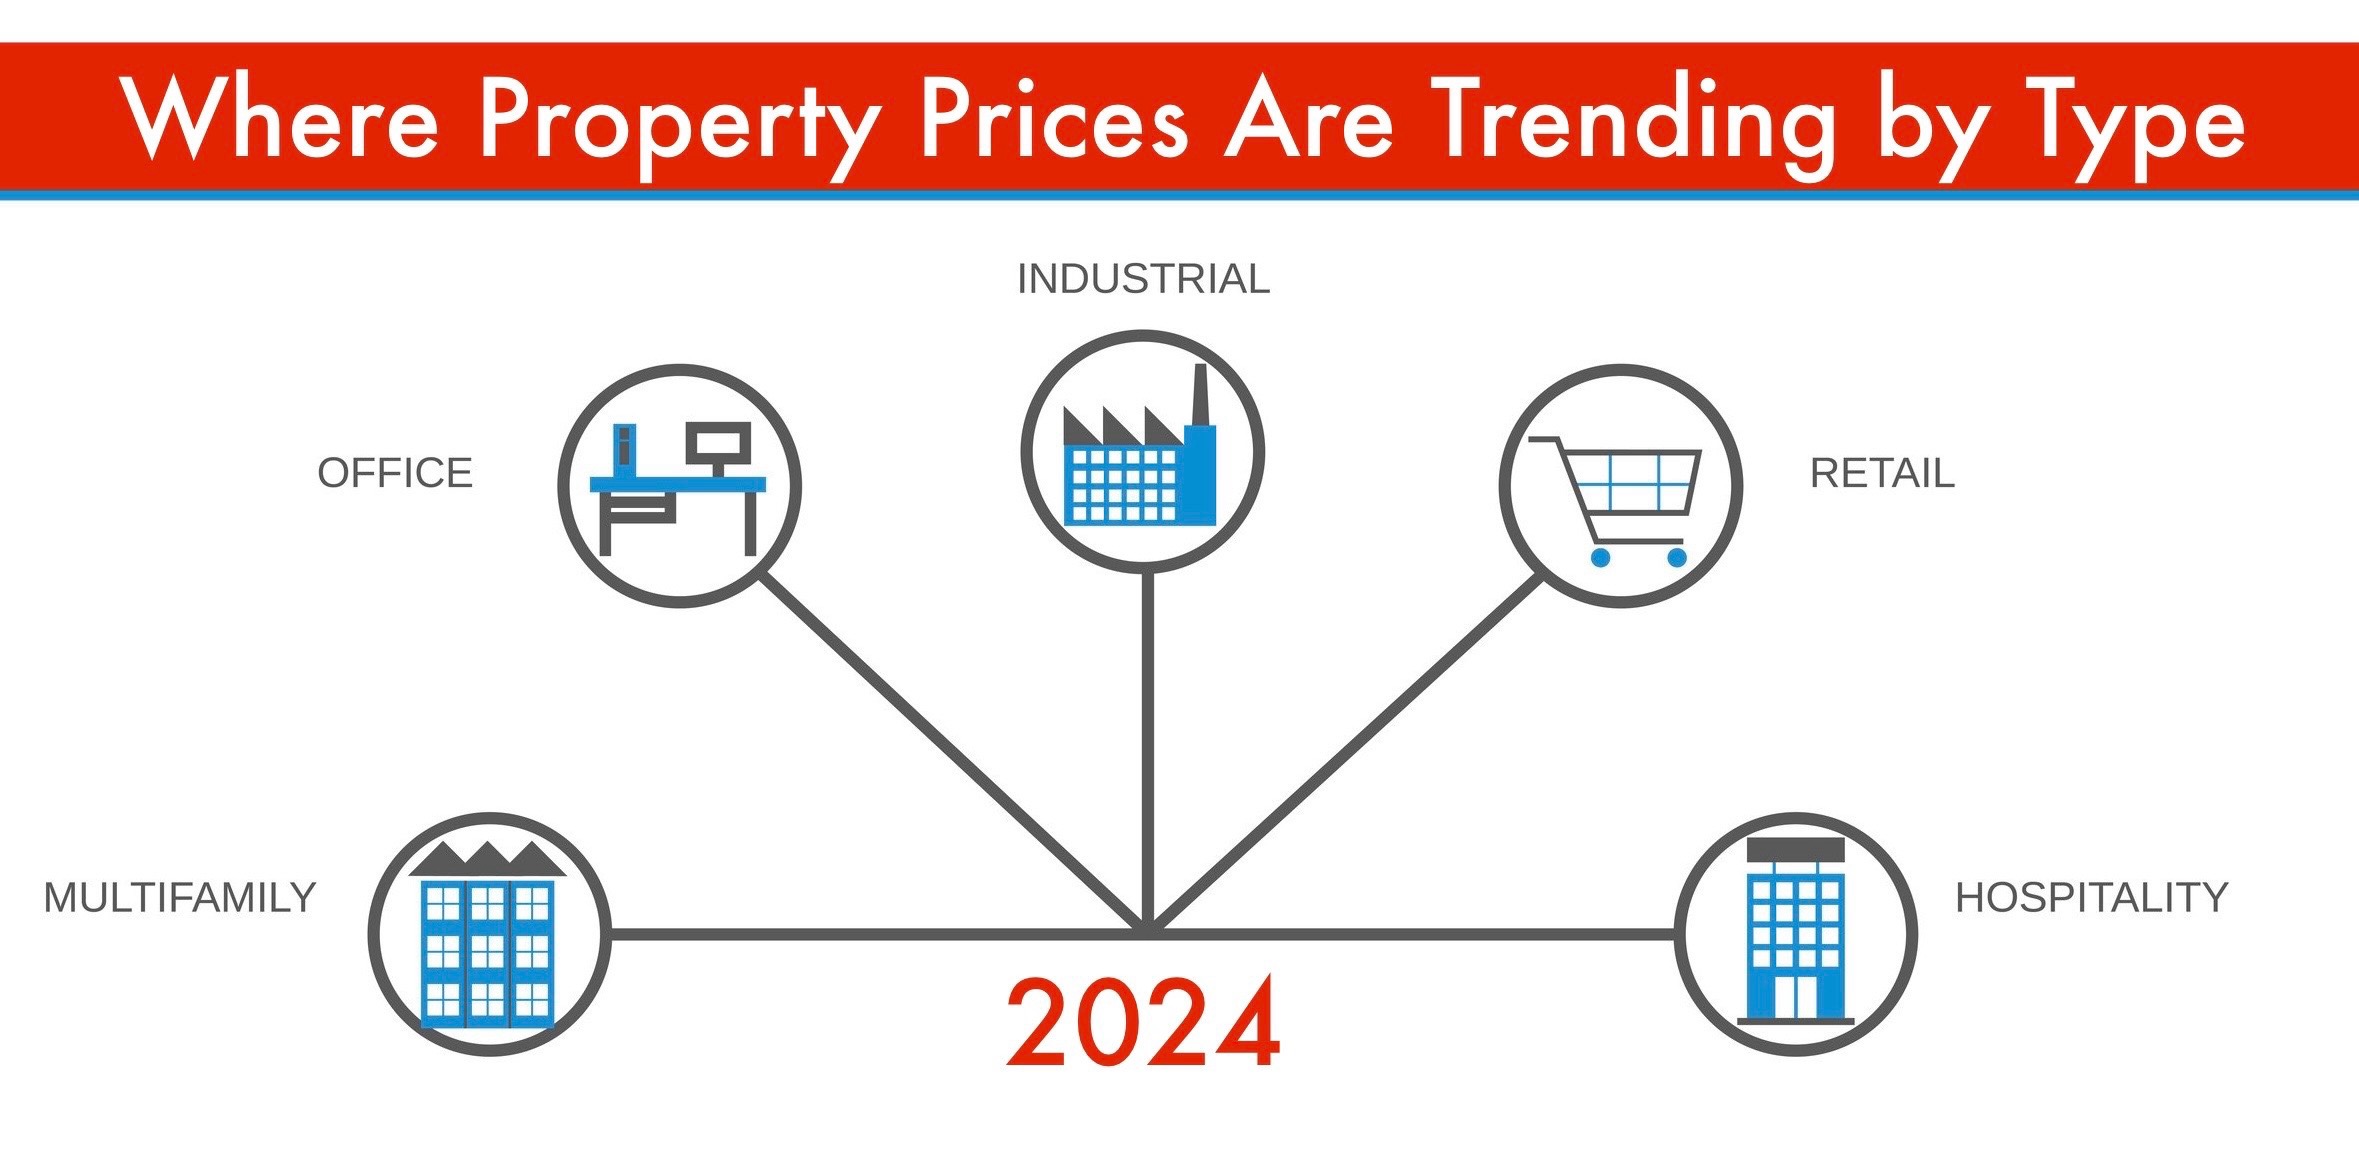
They had produced composite figures. Now they are also generating sector-specific figures for multifamily, office, retail, industrial, and lodging.
The composite for the first quarter of 2024 saw a quarter-over-quarter increase of 0.51% for a “slight improvement” in the CRE market. The year-over-year change was 0.66%. “However, when compared to its peak in mid-2022, the composite index is still 1.94% lower, indicating that the market has not yet fully rebounded despite possible signs of recovery in the most recent quarter,” they said.
Things can look quite different by sector, though. Multifamily was up 0.51% quarter over quarter but -2.25% year-over-year. Office was 1.33% month over month and 2.37% year over year. Retail, 0.16% and -0.36%. Industrial was down -0.56% month over month, flat year over year. Lodging was a full 4.0% up over last year.
But given all the ups and downs of the last few years — which sections were really hot, which were not — perhaps the most interesting figures are the change between the second quarter of 2022 and the first quarter of 2024. Composite was at -1.73%. Now, from worst to best, multifamily, -5.92%; industrial, -0.98%; lodging, 1.68%; office, 2.15%; and retail, 2.97%.
“The multifamily sector has been the primary driver behind the recent decrease in overall CRE prices, reflecting significant challenges in this market,” Trepp said. “This quarter, multifamily property prices stayed almost flat with a slight increase of just over 0.5% quarter-over-quarter but experienced a notable year-over-year decline of more than 2%.”
The performance of office may seem odd, considering all the predictions of doom that have been about. Trepp says that the results aren’t necessarily incompatible with market conditions. They attribute the performance to “inherent illiquidity” and owner reluctance to sell at a lower price. That puts a lid on transaction volumes and provides some insulation from falling price dynamics. Also, “these gains pale in comparison to the rate of appreciation that was anticipated pre-COVID, signaling a shift in market expectations and potential long-term changes in the valuation of office spaces.”
Retail has been relatively stable. Industrial, while benefiting from heavy demand, hasn’t been able to maintain the level of hype from the beginning of the pandemic.
Lodging is sensitive to consumer confidence and unpredictable travel trends. The category also typically has fewer transactions than other types of CRE, and so “makes it more susceptible to volatility.”
Source: https://www.globest.com/2024/06/20/where-property-prices-are-trending-by-type/